- Product introduction
- Detailed parameters
- Related resources
In optical fiber recording experiments, if the function of neural circuit regulation needs to be more accurately verified, optogenetic technology is usually combined with optogenetic technology, which uses an optical fiber to stimulate the upstream neuronal terminals at the same site, and at the same time record the downstream neuronal signals.
To achieve this, we optimize the optical path inside the optical fiber recording so that it can be connected to the optogenetic light source and output together with multiple excitation lights of its own. To avoid bleaching of calcium signals or neurotransmitter probes by optogenetic light sources, a 635 nm optogenetic light source that activates light-sensitive proteins such as ChrimsonR was combined with a fiber-optic recording device. Both the two-color system and the three-color system are available in optogenetic-compatible versions.

Schematic diagram of the connection mode and optical path
High stability light source, wavelength 410, 470, 561 nm and other options
The unique 410 nm control channel effectively removes noise interference
Customize the number of signal acquisition channels to achieve high-throughput signal acquisition
It can be combined with an optogenetic light source to achieve stimulation and recording at the same time at one site
Powerful acquisition and analysis software, easy to get started, one-click mapping
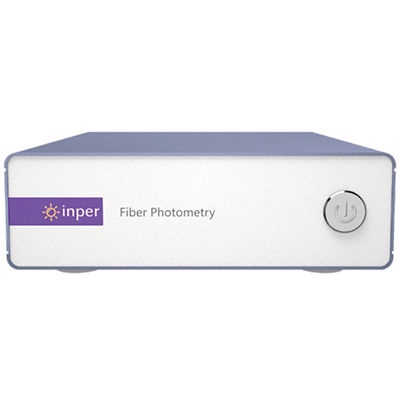
System host
Features:
* Stable laser or LED light source with excitation wavelengths of 410 nm, 470, 561 nm
* It is compatible with optogenetic devices, and the same point realizes photostimulation and signal acquisition
* High sensitivity and low noise sCMOS sensor
* High-quality optical lenses
* Abundant digital I/O interfaces
System software
Acquisition software

Analysis software: Inper Data Processing

Analysis software: Matlab Edition

The Inper Fiber Optic Recording System integrates acquisition and analysis software with a simple, easy-to-use interface that synchronizes video signals and behavioral events while acquiring signals. The software can set the signal sampling rate, CMOS camera exposure time, gain, etc., and has a real-time preview of the signal. At the same time, without using Matlab, Heat Mapping, △ F/F and Z-Score graphs can be directly exported and generated through the analysis software, which effectively improves the efficiency of data analysis. Of course, the recorded raw data can also be customized for analysis in software such as Matlab.

The use of Least-Squares Regression (least squares regression) can effectively reduce the noise effects associated with non-Ca2+ degeneration.


